About

Ahead of the Curve provides you with analysis and insight into today's global financial markets. The latest news and views from global stock, bond, commodity and FOREX markets are discussed. Rajveer Rawlin is a PhD and received his MBA in finance from the Cardiff Metropolitan University, Wales, UK. He is an avid market watcher having followed capital markets in the US and India since 1993. His research interests includes areas of Capital Markets, Banking, Investment Analysis and Portfolio Management and has over 20 years of experience in the above areas covering the US and Indian Markets. He has several publications in the above areas. The views expressed here are his own and should not be construed as advice to buy or sell securities.

Featured post

Time Series Analysis with GRETL

This video shows key time-series analyses techniques such as ARIMA, Granger Causality, Co-integration, and VECM performed via GRETL. Key dia...

Showing posts with label correction. Show all posts

Thursday 23 November 2017

Indian Market Volatility Surging Relative to US Market Volatility

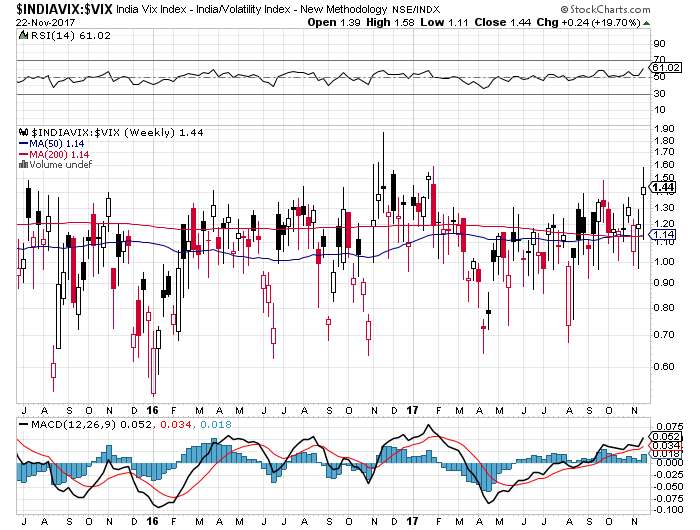
Indian market volatility has been surging off late relative to US market volatility much like in November 2016 when the last meaningful correction of 10% occurred. With the market close to record highs could complacency kill the cat yet again? Possible triggers - over valuation (p/e > 25), over bullish technicals, a slowing economy, you name it.

Visit StockCharts.com to see more great charts.

Thursday 8 September 2016

Chart of the Week - Libor Spikes Vs S & P 500

The chart of the week is courtesy Bob Hoye via SafeHaven and looks at spikes in the 3 month LIBOR rate vs S and P 500 performance. Any sustained spikes in LIBOR in excess of 25 basis points in the last year has often resulted in significant stock market pull backs as seen in August 2015 and February 2016. There is usually a lag of about 2 months for the sell off to occur. We had a recent LIBOR spike about 2 months ago and should see a stock market pull back soon. More importantly LIBOR has entered a clear uptrend this past year and that is problematic for risk assets long term:

Libor 2015-2016

Tuesday 31 May 2016

Chart of the Day - Time Taken to Reach Prior Highs

The chart of the day is courtesy Mark Hulbert via Marketwatch.com and shows the time taken for the Dow Jones Industrial Average to reach prior highs since the early 1900's. The current market has spent more than a year in trying to reach its prior high and has taken over 410 days to reach recent new highs, eclipsing the 379 days it took in the bull market correction of the 1990's making further new highs more and more elusive:
time to new highs

Stock Market News

Amazon Deals

World Indices


Live World Indices are powered by Investing.com

Market Insight

My Favorite Books

  • The Intelligent Investor
  • Liars Poker
  • One up on Wall Street
  • Beating the Street
  • Remniscience of a stock operator

See Our Pins

Trading Ideas

Forex Insight

Economic Calendar

Economic Calendar >> Add to your site

India Market Insight

My Asset Allocation Strategy (Indian Market)

Cash - 40%
Bonds - 20%
Fixed deposit - 20%
Gold - 5%
Stocks - 10% ( Majority of this in dividend funds)
Other Asset Classes - 5%

My belief is that stocks are relatively overvalued compared to bonds and attractive buying opportunities can come along after 1-2 years. In a deflationary scenario no asset class does well other than U.S bonds, the U.S dollar and the Japanese yen, so better to be safe than sorry with high quality government bonds and fixed deposits. Cash is the king always. Of course this varies with the person's age.