Indicator
|
Weekly Level / Change /
Significance
|
Implication for
S & P 500
|
Implication for Nifty*
|
S & P 500
|
2015, 3.26%
|
Bullish
|
Bullish
|
Nifty
|
8190, 3.05%
|
Neutral**
|
Bullish
|
China Shanghai Index
|
3183, 4.27%
|
Bullish
|
Bullish
|
Gold
|
1156, 1.58%
|
Bullish
|
Bullish
|
WTIC Crude
|
49.50, 8.39%
|
Bullish
|
Bullish
|
Copper
|
2.42, 3.18%
|
Bullish
|
Bullish
|
Baltic Dry Index
|
809, -9.00%
|
Bearish
|
Bearish
|
Euro
|
1.1358, 1.32%
|
Bullish
|
Bullish
|
Dollar/Yen
|
120.22, 0.27%
|
Neutral
|
Neutral
|
Dow Transports
|
8253, 4.82%
|
Bullish
|
Bullish
|
US 10 year Bond Yield
|
2.10%, 5.53%
|
Bearish
|
Bearish
|
Nyse Summation Index
|
-75, 83.42%
|
Bullish
|
Neutral
|
US Vix
|
17.08, -18.43%
|
Bullish
|
Bullish
|
20 DMA, S and P 500
|
1957, Above
|
Bullish
|
Neutral
|
50 DMA, S and P 500
|
1993, Above
|
Bullish
|
Neutral
|
200 DMA, S and P 500
|
2062, Below
|
Bearish
|
Neutral
|
20 DMA, Nifty
|
7940, Above
|
Neutral
|
Bullish
|
50 DMA, Nifty
|
8097, Above
|
Neutral
|
Bullish
|
200 DMA, Nifty
|
8378, Below
|
Neutral
|
Bearish
|
India Vix
|
18.92, -1.61%
|
Neutral
|
Bullish
|
Dollar/Rupee
|
64.71,-0.78%
|
Neutral
|
Bullish
|
|
|
|
|
Overall
|
S & P 500
|
Nifty
|
|
Bullish Indications
|
11
|
13
|
|
Bearish Indications
|
3
|
3
|
|
Outlook
|
Bullish
|
Bullish
|
|
Observation
|
The Sand P 500 and the Nifty
were up last week. Indicators are bullish. The Vix is back in complacency mode.
We are entering a weak period for risk assets globally and declines are
likely in both indices in the upcoming months following this bounce.
|
|
|
On the Horizon
|
China loan data, China, US, UK and New Zealand CPI, US Fed Beige Book, Australia employment data, Euro zone ZEW sentiment survey, US retail sales and consumer confidence.
|
|
|
|
|
|
|
*Nifty
|
India’s
Benchmark Stock Market Index
|
|
|
Raw Data
|
Courtesy
Google finance, Stock charts, FXCM
|
|
|
**Neutral
|
Changes
less than 0.5% are considered neutral
|
|
|
The markets rallied last week. Signals are bullish for the upcoming week and this bounce is on the verge of completion. The S and P 500 and several global indices are completing massive bear flags which should resolve to the downside. The markets are expected to encounter resistance at higher levels on any bounces, with the 2020-2030 zone on the S and P 500 acting as major resistance. There will be more downside upcoming in the #Nifty and the S and P 500, with at least a retest of the lows for the S and P 500 near 1867 and Nifty near 7550 in the upcoming months. You can check out last weeks report for a comparison. You can also check out snapshots of the S and P 500 and Nifty Indices. Love your thoughts and feedback.

In today's video, Christopher Greene of AMTV reports on George Soros and his massive put on the stock market.
There are ways to ensure your nest egg is not hit too hard in volatile times, and one is to be aware of how your super is tracking and how you can improve on it "
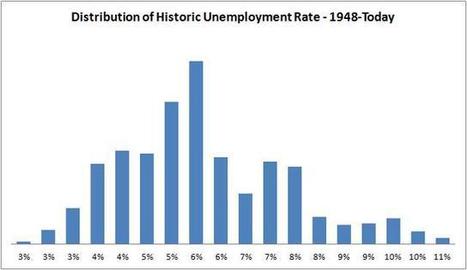
The unemployment rate is better than it's been in 67% of all months since 1948.With 64 straight months of employment gains, investors need to wake up the possibility that change is afoot.When employment..."
As fears go, deflation in the Eurozone is greatly overdone, in my opinion. Deflation is the mirror image of inflation and simply means that prices are falling, rather than rising.
The Motley Fool is a multimedia financial-services company that provides financial solutions for investors through various stock, investing, and personal finance products.
BullishMoney | With poor results from the September 2015 Jobs Report, investors are fundamentally concerned about a potential stock market crash in the Dow ..."
Indicator
|
Weekly Level / Change /
Significance
|
Implication for
S & P 500
|
Implication for Nifty*
|
S & P 500
|
1951, 1.04%
|
Bullish
|
Bullish
|
Nifty
|
7951, 1.05%
|
Neutral**
|
Bullish
|
China Shanghai Index
|
3053, -1.28%
|
Bearish
|
Bearish
|
Gold
|
1138, -0.69%
|
Bearish
|
Bearish
|
WTIC Crude
|
45.66, 0.71%
|
Neutral
|
Neutral
|
Copper
|
2.35, 2.78%
|
Bullish
|
Bullish
|
Baltic Dry Index
|
889, -5.73%
|
Bearish
|
Bearish
|
Euro
|
1.121, 0.14%
|
Neutral
|
Neutral
|
Dollar/Yen
|
119.89, -0.59%
|
Bearish
|
Bearish
|
Dow Transports
|
7874, 0.29%
|
Neutral
|
Neutral
|
US 10 year Bond Yield
|
1.99%, -8.26%
|
Bullish
|
Bullish
|
Nyse Summation Index
|
-452, -23.63%
|
Bearish
|
Neutral
|
US Vix
|
20.94, -11.35%
|
Bullish
|
Bullish
|
20 DMA, S and P 500
|
1945, Above
|
Bullish
|
Neutral
|
50 DMA, S and P 500
|
2002, Below
|
Bearish
|
Neutral
|
200 DMA, S and P 500
|
2063, Below
|
Bearish
|
Neutral
|
20 DMA, Nifty
|
7823, Above
|
Neutral
|
Bullish
|
50 DMA, Nifty
|
8131, Below
|
Neutral
|
Bearish
|
200 DMA, Nifty
|
8378, Below
|
Neutral
|
Bearish
|
India Vix
|
19.24, -7.89%
|
Neutral
|
Bullish
|
Dollar/Rupee
|
65.22,-1.38%
|
Neutral
|
Bullish
|
|
|
|
|
Overall
|
S & P 500
|
Nifty
|
|
Bullish Indications
|
5
|
8
|
|
Bearish Indications
|
7
|
6
|
|
Outlook
|
Bearish
|
Bullish
|
|
Observation
|
The Sand P 500 and the Nifty
were up last week after the S and P held prior lows. Indicators are mixed.
We are entering a weak
period for risk assets globally and declines are likely in both indices in
the upcoming months.
|
|
|
On the Horizon
|
US ISM data, Australia and UK rate
decisions, Canada and Swiss employment data, US Fed minutes.
|
|
|
|
|
|
|
*Nifty
|
India’s
Benchmark Stock Market Index
|
|
|
Raw Data
|
Courtesy
Google finance, Stock charts, FXCM
|
|
|
**Neutral
|
Changes
less than 0.5% are considered neutral
|
|
|
The markets bounced off support last week. Signals are mixed for the upcoming week and markets are in #crash mode. The #SandP500 and several global indices are completing massive bear flags which are resolving to the downside. The markets are expected to encounter resistance at higher levels on any bounces, with the 1980-1990 zone on the S and P 500 acting as major resistance. There will be more downside upcoming in the #Nifty and the S and P 500, with at least a retest of the lows for the S and P 500 near 1867 and Nifty near 7550 in the upcoming days. You can check out last weeks report for a comparison. You can also check out snapshots of the S and P 500 and Nifty Indices. Love your thoughts and feedback.
Market Insight
-
Visconti’s Latest Limited Editions: Where Art Meets Craftsmanship
-
In the first quarter of this year, Visconti has introduced three new
limited editions: the Galileo Galilei, the Il Magnifico Calacatta Gold, and
the Year o...
19 minutes ago
-
-
Strs Ohio Grows Holdings in Ovintiv Inc. (NYSE:OVV)
-
Strs Ohio grew its holdings in shares of Ovintiv Inc. (NYSE:OVV – Free
Report) by 31.0% in the 4th quarter, according to the company in its most
recent 13F...
1 hour ago
-
Next Gen Stock Market Profit Strategies for 2024
-
Mike Carr has a breakthrough profit strategy that is going to make your
2024 soar. Find out how this strategy can save you hours of research.
The post Ne...
1 hour ago
-
Daily Market Brief
-
Subscriber content. To subscribe to the Daily Market Brief please visit
Market Services on NorthmanTrader.com. The Daily Market Brief is an
in-depth market...
2 hours ago
-
Nvidia Chips To Power Softbank's Near $1B AI Investment: Report
-
SoftBank is set to invest a whopping $960 million over the next two years
to create a cutting-edge Japanese-language-specific generative AI model and
enh...
2 hours ago
-
Debt Rattle April 23 2024
-
Gustav Klimt The Park 1909 • Alina Habba Rages As Judge Approves Trump’s
$175 Million Bond (ET) • Will Trump Testify? (Victoria Taft) • Trump Urges
“Pe...
3 hours ago
-
Major Banks Debanking Christians
-
Debanking has become a major issue in recent years as institutions feel the
current government gives them leeway to discriminate against customers
based on...
7 hours ago
-
Three Stocks: Gold, Super Micro Computer, and Riot Platforms
-
Three Stocks: Gold, Super Micro Computer, and Riot Platforms
Gold Gold (GLD) prices dropped by 2.4% today, the largest drop in more than
two years. Shares ...
15 hours ago
-
S&P 500 PE Ratio
-
*Current S&P 500 PE Ratio:* 27.19 +0.24 (0.87%)
4:00 PM EDT, Mon Apr 22
15 hours ago
-
Is the 'Housing Shortage' the Result of Housing-Hoarding by the Wealthy?
-
*Those seeking to buy a house as shelter for their household can't compete
with the wealthy seeking assets to snap up and hoard for appreciation. *
*Longt...
17 hours ago
-
Monday links: not-so average years
-
Markets
- Commodities are having a standout 2024. (capitalspectator.com)
- When did investing become so political? (economist.com)
ETFs
- G...
18 hours ago
-
Alienating Tesla Buyers by the Cybertruck-load
-
@TBPInvictus here: Back in December 2022, I hypothesized that Elon
Musk’s antics and his newfound desire to own the Libs were going to destroy
Tesla’...
20 hours ago
-
State revenue from death and gift taxes : One of these things is not so
certain anymore
-
Estate taxes are commonly called “death taxes” because they’re levied on
the value of everything you own at the time of death. Only estates valued
above a ...
22 hours ago
-
Billions of cicadas are about to emerge from underground in a rare
double-brood convergence – Cooley & Simon
-
Billions of cicadas are about to emerge from underground in a rare
double-brood convergence Cicadas climb up a tree at the U.S. Capitol in
Washington, D.C....
1 day ago
-
“Weekend At Bernie’s Economy”: Joe Biden, Seeking Another Term, Wheels Out
The Corpse Of The U.S. Economy
-
When I was a kid, “Weekend at Bernie’s” was one of my all-time favorite
movies. In that film, two guys worked really hard to convince everyone
that thei...
1 day ago
-
Long Awaited
-
Weekly report covering Gold, Equities, Crude, Dollar. A look at trade
opportunities and covering the model portfolio.
The post Long Awaited appeared firs...
2 days ago
-
Total Number of Stocks Is Shrinking
-
[image: total number of nyse nasdaq issues traded]
The major averages may still be trending higher, but the total numbers of
issues traded on the NYSE an...
4 days ago
-
S&P 500 Yearly & Quarterly Pivot Levels | April - June 2024
-
First week of January breached Yearly Mid Resistance Level 1 (YMR1) at
4,781 to the upside. March consolidated above Yearly Resistance Level 1
(YR1). April...
4 days ago
-
How Investors Can Seize Opportunities in NVDA Amid Market Volatility
-
According to Todd Gordon, the founder of Inside Edge Capital, NVIDIA
Corporation (NVDA) is a strong buy despite a recent pullback. The chart
analyst also s...
5 days ago
-
-
Unveiling the Golden Opportunity: Maximizing Profits with GLD
-
Are you ready to seize the golden opportunity in trading? In our last
analysis, we forecasted a monumental breakout in the gold market, and the
results h...
1 week ago
-
Get More Out of Your Trades: Dukascopy Bank SA Cuts Withdrawal Fees
-
Dukascopy Bank SA would like to announce the reduction of withdrawal
transfer fees on trading products, as follows:
*Old fees* *New reduced fees*
3.5 EUR...
3 weeks ago
-
Weekend Update - Trendline rejection (3/8/24)
-
SPX was rejected by the blue trendline Friday. The trendline had been
sucessfully tested four times and held since November, until now. SPX has
unable ...
1 month ago
-
Catastrophic Risk: Investing and Business Implications
-
In the context of valuing companies, and sharing those valuations, I do
get suggestions from readers on companies that I should value next. While I
d...
2 months ago
-
Hello world!
-
Welcome to WordPress. This is your first post. Edit or delete it, then
start writing!
2 months ago
-
Teaching Johns Hopkins A Privilege Lesson
-
by Not Sure01/12/24Johns Hopkins Hospital Chief Diversity Officer Sherita
Hill Golden sent a letter out essentially implying that all people who
don’t look...
3 months ago
-
Mungerisms: Timeless Wisdom from Charlie Munger on Life and Business
-
"Mungerisms" are succinct expressions of wisdom and insights coined by
Charlie Munger, the Vice Chairman of Berkshire Hathaway and Warren
Buffett's longtim...
4 months ago
-
If You Find Deer or Elk Antlers on the Ground, Leave Them There, Say Some
States
-
Even though elk do shed their antlers naturally, collecting them brings up
a number of ethical issues.
6 months ago
-
It’s Crunch Time for The Daily Doom and Doom Time for The Great Recession
Blog
-
The Great Recession Blog is officially done for good, and it remains to be
seen if all my writing continues on TheDailyDoom.com. If my writing on
economi...
9 months ago
-
Innovative Industrial Properties Stock a Great Way to Play Pot Sector
-
*IIPR Stock Represents a Long-Term Opportunity*
Marijuana stocks briefly attracted investors' attention following the 2022
mid-term elections, when Maryl...
1 year ago
-
2008 analogue
-
The 2008 analogue tape looks very interesting from where we stand.
Let's anchor it to the next two Fed meetings -- since that's all that
matters -- and i...
1 year ago
-
Back to trade with Bar Replay
-
It is often said that one should not be sad about the past, but sometimes
it can be nice to return to it. Who would like to buy Tesla for $1 and
experience...
1 year ago
-
After This Holiday Rally, You Better Know When To Walk Away
-
This week’s investor insight will make you think twice about the current
stock and bond rally as we head into the end of the year. We get a lot of
questi...
1 year ago
-
How Africa Can Escape Chronic Food Insecurity Amid Climate Change
-
The toll of extreme weather events on crops underscores the region’s
challenges and need for policies to save lives and protect livelihoods.
1 year ago
-
12 Bear Market Rules To Live By – Survive & Thrive In The Next Bear Market
-
12 Bear Market Rules To Live By – Survive & Thrive In The Next Bear Market
[image: Bear Market Rules Survival Guide]
I grew up in the 1970s-1980s when th...
1 year ago
-
Growth Companies – Getting What You Want
-
What do the growth companies in your field have in common? How are they
doing so well and what can you learn from them? Growth companies usually
make a pro...
1 year ago
-
-
Blog Post Title
-
What goes into a blog post? Helpful, industry-specific content that: 1)
gives readers a useful takeaway, and 2) shows you’re an industry expert.
Use your c...
2 years ago
-
Foot Locker Crushed Q2 Earnings Expectations Sending Stock Higher
-
Plus, AstraZeneca said its antibody therapy reduced the risk of developing
COVID-19 symptoms by 77%, The Topps Co’s SPAC merger is off, and Elon Musk
annou...
2 years ago
-
Elliott Wave Stock Market Update - July 10th
-
The market has continued its rally to higher highs and it doesn't seem like
it wants to stop. We now have a new ATH at 4371 which are NASDAQ levels
s...
2 years ago
-
The Psychology of QE is Far More Important Than the Amount of It
-
Let's discuss what QE really does vs the psychology of QE.
2 years ago
-
Hello world!
-
Welcome to WordPress. This is your first post. Edit or delete it, then
start writing!
3 years ago
-
Trading: Opportunities Are Dispersed
-
Opportunities are dispersed. You might have an... *READ THE REST OF THE
ARTICLE ON THE NEW WEBSITE: JIM ROGERS TALKS MARKETS *
*Jim Rogers is a legendary i...
3 years ago
-
Market Signals for the US stock market S and P 500 Index and Indian Stock
Market Nifty Index for the Week beginning November 09
-
Indicator Weekly Level / Change Implication for S & P 500 Implication for
Nifty* S & P 500 3509, 7.32% Bullish Bullish Nifty 12264, 5.34% Neutral **
Bullis...
3 years ago
-
-
Fully Automated Trend Trading w/ Stocks Or Options
-
There’s a lot of research to support the usage of trend indicators as
simple risk reduction elements that can be layered onto an existing
strategy. Howev...
3 years ago
-
2020 Top Investment Picks – Q3 Update
-
At the beginning of the year, I put together a list of Top Investment Picks
for 2020 from the investment community and track them on this website. This
is ...
3 years ago
-
Upside-Down Markets: Profits, Inflation and Equity Valuation in Fiscal
Policy Regimes
-
I just published a new long-form piece through OSAM entitled “Upside-Down
Markets: Profits, Inflation and Equity Valuation in Fiscal Policy Regimes.”
In th...
3 years ago
-
The last of 12326
-
February 22nd 2012.....
First post...
https://permabeardoomster.blogspot.com/2012/02/can-anyone-fly-plane.html
--
This post will be the last under the o...
3 years ago
-
-
6/7 to 10/7, 2020 Nifty & Bank Nifty, Bharat Forge, IBhasgFin & RIL.
Weekly futures Pr...
3 years ago
-
Ultramarathoner Runs Over 200 Miles in Backyard, Wins Golden Toilet Paper
Roll
-
Strange times indeed. In the land “BC,” before coronavirus, people ran long
distances in foot races, and toilet paper wasn’t coveted. Things have
changed. ...
4 years ago
-
One Year Later
-
A year ago today I lost my father and my best friend, everyone here lost
their mentor and a friend. Dad and I spent the last 7 years of his life
living tog...
4 years ago
-
-
Advanced Micro Devices (AMD) Retreating Towards Key Support Around
$25.60-$27
-
AMD has failed to clear the
2018 high around $34.20. It is retreating, and has broken an
August/September sup...
4 years ago
-
Advanced Search is Now on Stocktwits
-
Advanced Search Is Now on Stocktwits
Come rain or shine, the Stocktwits community shares over 200,000 messages
per day. That includes charts, news, trade i...
4 years ago
-
Nightly Algo Report – December 6, 2018
-
To access this post, you must purchase Premium Plan or Premium Plan -
Annual.
The post Nightly Algo Report – December 6, 2018 appeared first on
Elliottwa...
5 years ago
-
Don’t be Fooled by the Pullback in the Dollar Because….
-
Don’t be fooled by the pullback in the U.S. dollar today because the
greenback could still strengthen further before the end of the year. Nearly
all of the...
5 years ago
-
A look at the bull market ahead
-
My latest missive on the near-term stock market outlook can be seen at
Financial Sense web site. You can see it by clicking on the following link:
https:/...
6 years ago
-
Weekly Videos
-
This week’s video will be posted on the new home for Short Takes. If all
goes well, it will appear sometime between 6:00 and 8:00 pm ET.
6 years ago
-
Gold Miners near a buy zone
-
Gold cleared a several month long consolidation a few weeks ago as it
cleared $1300, and has since been consolidating as it drifts back to […]
The post G...
6 years ago
-
Current Account Deficits and Safe Assets
-
The International Monetary Fund has issued its External Sector Report for
2017, and among its key findings: “Global current account imbalances were
broadly...
6 years ago
-
Kafka For The Twenty First Century
-
I've been spending a slightly frustrating day trying to update my payment
details at google. To log in to my admin console I need to log in using my
G Sui...
7 years ago
-
Gold Unleashed by Fed
-
Gold's next major upleg was likely unleashed by a very-dovish FOMC this
week, which now has its hands tied on hiking rates or being hawkish due to
the US e...
7 years ago
-
August 24th Blogger Sentiment Poll
-
There are more bulls than bears in this week's poll. Blogger Sentiment Poll
Participants: 24/7 Wall St (N) Carl Futia (+) Dash of Insight (+) Elliot
Wave L...
14 years ago
My Favorite Books
- The Intelligent Investor
- Liars Poker
- One up on Wall Street
- Beating the Street
- Remniscience of a stock operator
India Market Insight
-
Technical View: 22,500 crucial for further upside in Nifty, India VIX at
9-month low
-
[image: Technical View: 22,500 crucial for further upside in Nifty, India
VIX at 9-month low] The monthly options data suggested that the Nifty may
face hu...
34 minutes ago
-
OFSS HERO MOTO VOLTAS Darvas Box Analysis
-
OFSS Positional Traders can use the below mentioned levels Close above
7569 Target 8000 Intraday Traders can use the below mentioned levels Buy
above ...
8 hours ago
-
Rupee falls 29 paise to close at 82.68 against US dollar
-
During the day, the rupee touched a high of 82.45 and a low of 82.68
against the greenback. On Friday, the rupee had settled at 82.39 against
the dollar.
10 months ago
-
-
ES Hourly cloud and 4 Hour chart
-
- ES Hour moving towards the hourly cloud which may act as resistance.
- 4 Hour chart shows a possible bullish candle which may give new high's
...
2 years ago
-
JUST NIFTY BLOG 10-01-2020
-
Bulk Deals FII DII Stats Date # of Deals Total Volume (In Millions)
01-01-1970 0 0.00 Click here to see all Bulk Deals Date Category Buy Amount
(Rs. Cror...
4 years ago
-
Vist Note on Federal Bank
-
We recently met the senior management of Federal Bank which is one of the
old private sector banks with a distribution network of 1252 branches (48%
Kerala...
6 years ago
-
Nifty Bulls bounces ferociously holding 9930,EOD Analysis
-
FII's bought 4.8 K contract of Index Future worth 262 cores ,9.7 K Long
contract were added by FII's and 4.8 K Short contracts were added by FII's.
Net Ope...
6 years ago
-
Midcap & Smallcap Index Corrects, Lets Come Back To Fundamentals Again
-
Midcap Index had made a high of 18511 on 16th May 2017, fell almost 7% and
is currently trading at 17230. Smallcap Index made all time high of 7679 on
11th...
6 years ago
-
Market outlook for 30/10/2016
-
*Nifty closed up 22.75 points (0.26%) at 8638.00* while Future closed at
8667.40, premium of 29.40 points.
*Bank Nifty closed up 41.35 points (0.21%) at 19...
7 years ago
-
Option Open Interest for 28-10-2016
-
Inference The index opened flat to positive and after making an initial low
around 8581 saw some short covering to close at 8638.00, gain of 22.75
points. ...
7 years ago
-
Market Review for 23rd August 2016
-
*Nifty (8629)* we said ‘technically trend is still intact but there exists
selling pressure near 8746 and support around 8600 zones’ the Nifty
unfolded as...
7 years ago
-
ITC To Resume Cigarette Manufacturing
-
ITC manufactures a range of cigarette brands, including India Kings,
Classic, Gold Flake, Navy Cut, Capstan, Bristol, Flake, Silk Cut, which are
manufactur...
8 years ago
-
My Asset Allocation Strategy (Indian Market)
Cash - 40%
Bonds - 20%
Fixed deposit - 20%
Gold - 5%
Stocks - 10% ( Majority of this in dividend funds)
Other Asset Classes - 5%
My belief is that stocks are relatively overvalued compared to bonds and attractive buying opportunities can come along after 1-2 years. In a deflationary scenario no asset class does well other than U.S bonds, the U.S dollar and the Japanese yen, so better to be safe than sorry with high quality government bonds and fixed deposits. Cash is the king always. Of course this varies with the person's age.